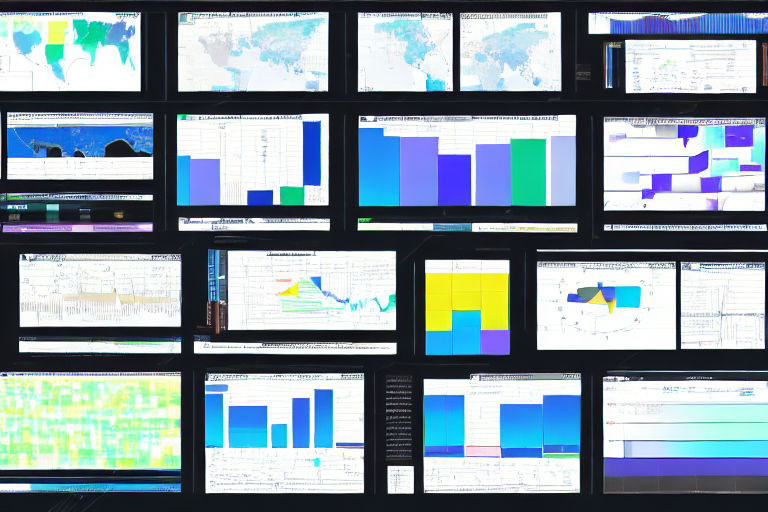
How to Choose the Right Visualization Technique for Your Data
Effective data visualization is an essential tool for businesses, researchers, and individuals who want to make sense of large, complex data sets quickly. While there are many different visualization techniques out there, choosing the right method for your data is critical if you want to extract valuable insights and communicate them effectively.
Consider Your Data
The first step in selecting an appropriate visualization technique is to think about the nature of your data. Different data sets will lend themselves better to certain types of visualizations. For example, if you are working with geographic data or data that has a spatial component, a map might be the best way to represent your information. On the other hand, if you are working with time series data, a line graph might be more effective.
It's also important to consider the size of your data set. If you have a large amount of data, visualization techniques that help to reduce the complexity of the data, such as heat maps or hierarchical clustering, might be more appropriate than those that show individual data points.
Think About Your Audience
The next consideration when choosing a visualization technique is your audience. What type of person will be viewing your data, and what are their goals? For example, if you are presenting to an audience that is not familiar with your industry or field, you may need to use more basic visualizations that are easier to understand.
Pick the Right Visualization
Once you have considered the nature of your data and your audience, it's time to select a visualization technique that will work best. Here are some of the most commonly used types of visualizations:
- Line Charts: Great for showing trends and time series data over a period of time.
- Bar Graphs: Ideal for comparing data across different categories.
- Scatter Plots: Useful for identifying patterns and correlations between two different variables.
- Heat Maps: Ideal for displaying large amounts of data and spotting trends or outliers.
- Tree Maps: Useful for displaying data with hierarchical structures (such as file directories or organizational charts).
- Geographic Maps: Effective for showing data with a spatial component, such as population demographics or weather patterns.
By selecting the right visualization technique, you can make your data more engaging and easier to understand for your audience. Remember to consider the nature of your data, your audience, and the type of story you want to tell before making a final decision.
Conclusion
Data visualization is an essential tool for anyone who wants to make sense of complex data sets. By choosing the right visualization technique, you can communicate your insights effectively and engage your audience. When selecting a visualization technique, consider the nature of your data, your audience, and the story you want to tell.


